|
by Frank J. Jochem AGU Ocean Sciences Meeting 2000, San Antonio, Texas, January 2000
Abstract
The distribution of pelagic bacteria along two onshore - offshore
transects in the western Gulf of Mexico was assessed aboard the RV Longhorn
in July and October 1999. Cell abundance was estimated by epifluorescence
microscopy after DAPI staining and by flow cytometry after DNA staining with
SYBR Green. Bacteria abundance in the upper 200 m of the water column ranged
from 88x103 to 1350x103 cells ml-1.
Bacteria exhibited surface maxima in July but subsurface maxima within the
chlorophyll maximum in October. In July, abundance over the continental shelf was
up to 2 times higher than at offshore stations. Regional differences were lower in
October as were bacteria abundances in general.
Epifluorescence microscopy revealed three morphotypes of bacteria: cocci; rods;
spirillae and curved bacteria. Cocci (48-58% of total bacteria) were the most common
morphotype. Rods and spirillae/curved bacteria had similar shares, which were higher
in October than in July. Flow cytometry revealed 4 bacterial sub-populations
distinguished by their DNA content. DNA-types do not seem to reflect morphotypes.
For total bacteria, flow cytometry results correspond to those from epifluorescence
microscopy. Analyses of formalin-fixed samples performed immediately after the October
cruise exhibited a close to 1:1 relationship between the two methods.
Material and Methods
Samples for bacteria counts were taken by CTD-mounted Niskin-type water bottles from
8-10 depths in the upper 200 m water column at 6 stations on July 21-24, 1999, and at
5 stations on October 21-25, 1999, in the western Gulf of Mexico (Fig. 1). Samples were
fixed by 1% (final conc.) formaldehyde and stored at 4°C in the dark until analyses.
For epifluorescence microscopy, 0.5 to 1 ml of sample was diluted with 0.2 µm filtered
seawater to a final volume of 5 ml, incubated with DAPI (1 mg l-1 final conc.)
for 5 min and filtered onto black 0.2 µm Nuclepore filters. Filters were stored frozen
until counted under UV excitation on a Zeiss Axioskop microscope. Depending on abundance,
200-500 cells were counted on 60-200 view fields. Cell counts of coccoid bacteria were
corrected for Prochlorococcus abundance derived from flow cytometry analyses of
unstained samples. Prochlorococcus would also be counted as coccoid bacteria
on DAPI-stained filters and can overestimate bacteria abundance (Sieracki et al. 1995). 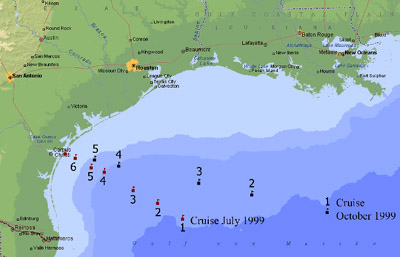 Fig. 1: Sampled stations during R/V Longhorn cruises in July and October 1999 in the western Gulf of Mexico. The July transect reached 328 km into the Gulf, the October transect 658 km.
For flow cytometry, 1 ml of fixed samples was incubated for 30 min at 37°C with 0.1 g
l-1 RNAse (1:1 mix of RNAse A and B) prior to staining with SYBR Green I
(10-5 dilution of commercial stock; Molecular Probes, Eugene, OR) in the
presence of 30 mM potassium citrate (Marie et al. 1997). After 10 min of staining,
samples were analyzed on a Becton-Dickinson FACSort flow cytometer. Bacteria cell size
was assessed by Side-Angle Light Scatter (SSC). Due to its broad emission spectrum,
SYBR DNA- fluorescence was detected both in the green FL1 (535±15 nm) and the red
fluorescence FL3 (>650 nm) channels. All signals were recorded on a four-decades log
scale. Data were analyzed by PC Lysys software (Becton-Dickinson, San José, CA). In
near-surface samples, where prochlorophytes and bacteria were not separated in the
cytometric analyses, bacteria measurements were corrected for prochlorophyte counts
from unstained fixed samples measured on the same day.
Bacteria Counts by Microscopy and
Flow Cytometry
Three different types of bacteria were identified under the microscope: coccoid, rod-
shaped, and curved bacteria (Fig. 2). Most rod-shaped bacteria were small, but some
samples contained elongated rods in low numbers. Among curved bacteria, small C-form
cells were most abundant. Large C-form and large S-form cells occurred in variable but
relatively low numbers. For statistically significant cells counts, all variations in
curved bacteria were cumulated. 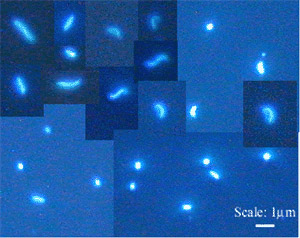 Fig. 2: Different morphotypes of pelagic bacteria, DAPI staining: Cocci, rod-shaped, and curved cells. Curved cells comprised small and large C-forms and large S-forms.
In flow cytometric analyses, 4 clusters of bacteria were distinguished by DNA content
(Fig. 3). All clusters were present in all samples. Clusters B-Ia and B-Ib probably
correspond to B-I bacteria as cytometrically identified and termed by Li et al. (1995)
and Marie et al. (1997) in samples from the North Atlantic, the Mediterranean and the
English Channel. Cluster B-III probably corresponds to B-III of Marie et al. (1997),
which was not detected by Li et al. (1995). A cluster termed B-II by Li et al. (1995)
and Marie et al. (1997), distinguished by higher DNA content but lower light scatter
compared to B-I, was not detected. Instead, a high DNA content and light scatter cluster
indicating larger cell size (B-IV) occurred. 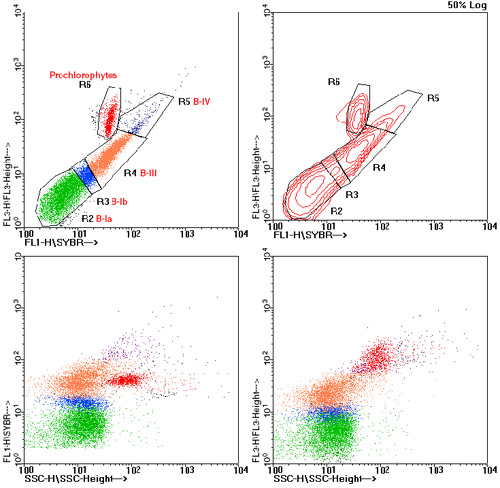 Fig. 3: Cytometric analysis of bacteria revealed 4 types of bacteria distinguished by their DNA content. Only population B-IV exhibited higher light scatter (SSC) indicative of larger cell size. B-III was the most abundant DNA type. Cell types named after previously published results (see text). Prochlorococcus were separated from bacteria cells in two-parameter-histograms except for surface-near samples.
Bacteria counts by microscopy and flow cytometry were correlated significantly (Fig. 4).
For the July cruise, cytometric analyses were performed 2.5 months later from formalin-fixed samples stored at 4°C. Recovery of total bacteria was 65% compared to microscopy.
This number compares to the reported loss of bacteria cells in such stored samples over
time (Turley & Hughes 1992, Troussellier et al. 1995). In October, microscopic and
cytometric analyses were performed immediately after the cruise. The relationship
between both estimates of total bacteria abundance is close to 1 (0.903 ± 0.022).
Regression analysis showed that none of the cytometrically established DNA-types of
bacteria reflected any microscopically identified morphotype. 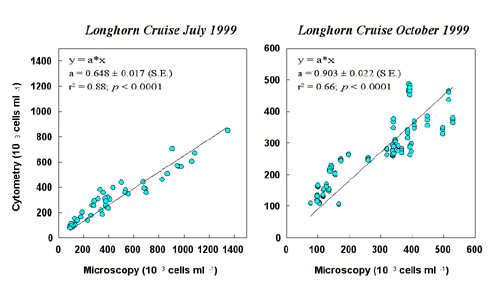 Fig. 4: Comparison of bacteria abundance derived from microscopic counts and flow cytometry analysis. Distribution of Bacteria
In July, bacteria exhibited surface maxima of abundance, ranging from ~400x103 cells
ml-1 offshore to ~1000x103 cells ml-1 inshore. Only
the shallow (60 m) shelf Stn 6 showed a near-bottom maximum of 1350x103 cells
ml-1. In October, subsurface maxima of 300-400x103 cells
ml-1 occurred within the chlorophyll maximum, and abundance did not increase
towards the shelf as recorded in July. Typical profiles of both cruises are depicted in
Fig. 5. 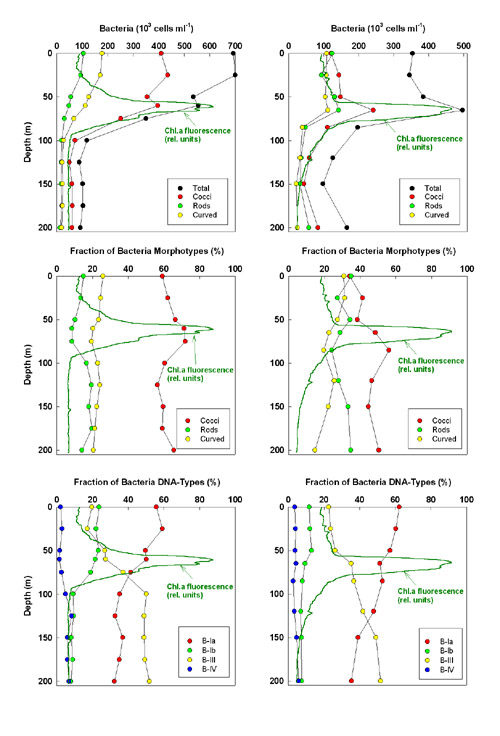 Fig. 5: Vertical profiles of bacteria abundance (upper row), fractions of the three morphotypes distinguished by microscopy to total bacteria (middle row), and fraction of the four DNA types established by flow cytometry to total bacteria. Left column: Stn 4 (105 km off shore) of July cruise; right column: Stn 3 (334 km off shore) of October cruise. Profiles of chlorophyll fluorescence from CTD casts (relative units) are overlaid
Cocci were the most abundant morphotype of bacteria, but their dominance was much higher
in July (58 ± 7%) than in October (48 ± 6%). Rod-shaped and curved bacteria were equally
abundant in October (27 ± 5% and 25 ± 5%), but curved bacteria were a little more abundant
than rods in July (18 ± 4% and 24 ± 5%). During cruises, maximum shares of cocci, and
minimum shares of rods and curved bacteria, occurred within the lower part of the
chlorophyll subsurface maximum (Fig. 5). B-Ia and B-III were the most abundant DNA-types
of bacteria during both cruises. B-Ia dominated the upper water column to the bottom of
the chlorophyll subsurface maximum, whereas B-III were dominant below the euphotic zone.
B-Ib followed the vertical distribution of B-Ia, whereas the larger B-IV bacteria also
gained a higher share below the euphotic zone. The vertical pattern of DNA-types depicted
in Fig. 5 was consistent at all stations.
Bacteria abundance integrated over 200 m water depth was higher in July than in October
(Fig. 6, gray bars). Except for the shallow shelf stations, integrated abundance showed
minor regional variation. Despite their high cell numbers per liter, the shelf stations
exhibited lower integrated abundances due to their shallow depths. Among the morphotypes,
the shares of cocci tend to decrease towards the coast, and those of curved bacteria tend
to increase. Among the cytometric DNA-types, larger B-IV bacteria seem to be more important
at offshore stations. Despite some variation in the shares of the different DNA-types, no
regional trend or major variation is discernible (Fig. 6). 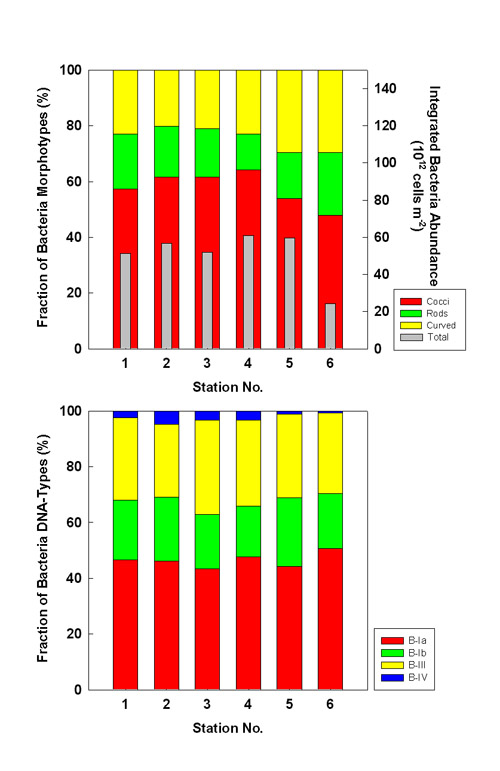 Fig. 6a: Fraction of microscopic morphotypes (upper) and cytometric DNA-types (lower) to total bacteria numbers integrated over 200 m water depth in July 1999. Integrated abundance (1012 cells m-2) is overlaid as gray bars in upper graph. 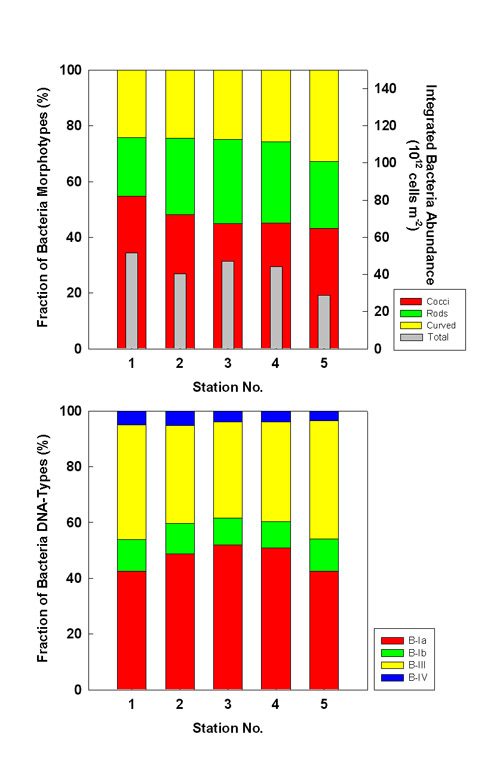 Fig. 6b: Fraction of microscopic morphotypes (upper) and cytometric DNA-types (lower) to total bacteria numbers integrated over 200 m water depth in October 1999. Integrated abundance (1012 cells m-2) is overlaid as gray bars in upper graph. Conclusions
References
Li WKW, Jellett JF, Dickie PM. 1995. DNA distributions in planktonic bacteria
stained with TOTO or TO-PRO. Limnol Oceanogr 40: 1485-1495. |