|
by
Frank J. Jochem
Objectives of Cytometric DNA Cell Cycle Analysis in Marine PhytoplanktonBased on theoretical considerations and appropriate equations on the "Frequency of Dividing Cells" technique, DNA cell cycle analysis allows the calculation of phytoplankton gross growth rates, one of the crucial parameters in the analysis of planktonic food webs. The major advantage of cytometric DNA analysis as compared to hitherto employed techniques is that growth rates can be estimated from in-situ material without further incubations, which may bias algal growth and the subsequent growth rate estimates. Application of flow cytometry allows rapid and precise estimates (examples depicted here are based on the analysis of 10,000 cells each) and a differentiation of different phytoplankton sub-populations (e.g. prochlorophytes, coccoid cyanobacteria, small flagellates, etc.). |

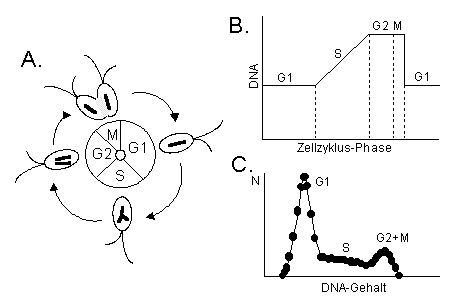
Fig. 1: A. Model of a Cell Cycle (DNA replication and cell division, nuclear membrane left out). B. Cellular DNA content during the different cell cycle phases - G2+M phase cells posses double the DNA amount as compared to non dividing G1-phase cells, after mitosis and cell division, the cellular DNA content reaches G1 level again. C. Frequency histogram of DNA content (in cytometric measurements equivalent to DNA stain fluorescence) - analysis of DNA frequency histograms reveals the proportion of the algal population within the cell cycle phases G1 (non dividing cells), S (DNA replication), and G2+M (Mitosis and cell division). |


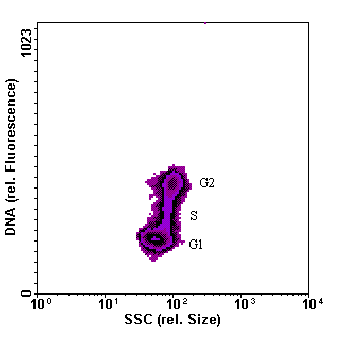
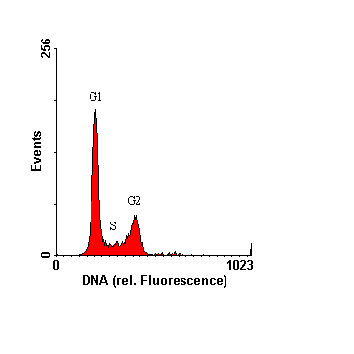
Fig. 2: Example of flow cytometric DNA analysis, coccoid cyanobacterium Synechococcus sp. from the Baltic Sea (cultured). Upper panel: 2-parameter histogram of cellular DNA content versus cell size, lower panel: frequency histogram of cellular DNA content. The different cell cycle phases are indicated in the histograms; as prokaryotic cyanobacteria do not undergo mitosis as eukaryotes, "G2+M" is reduced to "G2". The left panel reveals that cells in G2 phase (directly before cell division) are slightly bigger than non dividing cells (G1). |

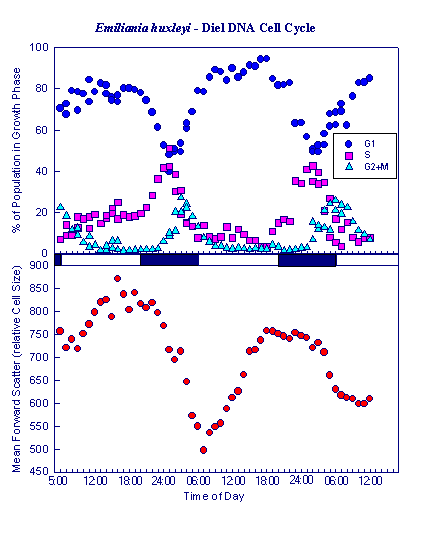
Fig. 3: Diel DNA Cell Cycle of Emiliania huxleyi in Laboratory Culture: upper panel: Fraction of total population in growth phase G1 (Cells not in division), S (Cells in DNA replication), and G2+M (Cells with double DNA amount in mitosis); lower panel: Mean cellular Forward Angle Light Scatter (FSC) as a measure of mean cellular size. |
Figure 3 displays a diel cell cycle of the marine coccolithophorid Emiliania huxleyi grown in exponential growth in laboratory cultures with a light:dark cycle of 06:00 to 20:00 hrs light and a temperature of 18°C. DNA cell cycle analysis reveals that DNA replication starts (follow S-Phase curve!) at the beginning of the dark phase. Around midnight, most cells are in the DNA replication S-phase. Mitosis starts at the end of the dark phase (follow G2+M curve). Cell division occurs at the onset of light, marked by the decrease in the mean cell size of the population (lower panel). This diel cycle makes sense to exponential algal growth in that the light period can be used for photosynthesis and accumulation of energy equivalents, whereas energy consuming processes of DNA replication and cell division occur in the dark, the daughter cells being prepared for photosynthesis by the onset of the next day. What's new with the new cytometric DNA technique developed here?The new DNA staining technique allows for the first time to measure both DNA and chlorophyll fluorescence simultaneously on an argon laser based bench top cytometer with blue light excitation.Hitherto applied techniques used either big laboratory machinery equipped with UV excitation and UV-excitable DNA dyes such as DAPI and Hoechst stain. With bench top machines (that could be taken at sea), equipped only with blue light excitation (488 nm), DNA with the red fluorescent dyes propidium iodide or ethidium bromide involved methanol extraction of chlorophyll prior to DNA analysis as chlorophyll exhibits red fluorescence as well. Most of the fragile naked nanoflagellates of marine systems did not, however, sustain methanol treatment. Moreover, the red chlorophyll fluorescence is essential for the analysis of natural samples as it is used as a trigger to differentiate phytoplankton from other (non living and heterotrophic) particles. Such DNA dyes could, therefore, be only used in monospecies cultures and rigid cells such as diatoms. The new DNA dyes used shows green fluorescence under blue light excitation and does not interfere with chlorophyll fluorescence. The new DNA staining technique does work with both prokaryotic and eucaryotic algal cells. Hitherto published cell cycle analysis with the UV excitable DNA dyes DAPI and Hoechst were only successful with prokaryotic cells, namely prochlorophytes. All published cell cycle measurements on eucaryotic cells relied on the red fluorescent dyes propidium iodide and ethidium bromide, which are not applicable with natural samples. |