1. Mesurement of Primary Production
- Net biomass production: compare change of stocks over time DB/Dt. Problem: only possible in pure cultures, grazing loss in nature will mask production and often there is no net change in phytoplankton stocks, grazing = production!
- Model production from P vs I curves: requires precise knowledge of a und the assimilation number; light field and chl.a biomass easy to measure
- Assimilation Index = Assimilation Number = Production/Chl.a
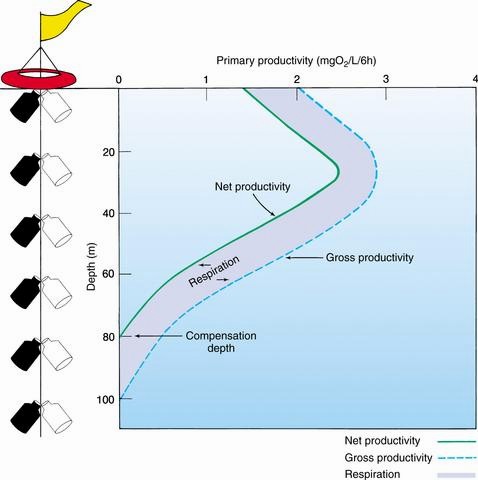
- Oxygen development in light & dark bottles: Increase in light = net production, decrease in dark = respiration, Light Dark = gross production. Problem: does not account for photorespiration of algae, zooplankton and bacteria respiration! Also requires conversion of produced O2 to fixed carbon: photosynthetic quotient PQ = DO2/DCO2, mostly 1.1-1.2, up to 1.4 if lipids are predominantly formed
- Isotope methods: 14C is standard, easy, cheap, but involves radiation safety and waste disposal; 13C also used (Japan, radioisotopes prohibited), expensive
- All incubation techniques: in-situ or simulated in-situ
unit: mg C (mg Chl.a)-1 h-1
range: 2 10 healthy marine plankton
In-situ incubation: hang light and dark bottles on floating rigg for time of incubation. Problem: ship has to stay near the rigg or has to come back after incubation time; often on big ships this is not feasible due to too many different interests among the numerous scientists and working groups.
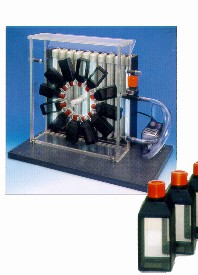
Simulated in-situ incubation: Special fluorescent lights that possess light spectrum similar to natural sun light. Samples are incubated in bottles coated with different neutral density filters to mimick the exponential decrease of light intensity with depth. Bottles are mounted to rotating wheel to keep planton afloat within a water-cooled plexiglas chamber for temperature control.
The 14C Method
- Simple technique, but problems with radiation safety and waste disposal
- Incubate light and dark bottles with known addition of H14CO3
- Production calculated as:
- [CO2] has to be determined separately by titration or from tables (function of salinity)
- P is a measure between gross and net production
- Method cannot account for organic carbon produced and excreted during incubation: exudation
- Long incubations: multiple interaction within microbial food web bias estimates, part of primary production already consumed by small grazers within bottles
- Areas of picoplankton dominance: use small pore filters not too loose too many! (0.2 µm)
P = (RL - RD) x [CO2] / (R x t)
with P = Production; R = added radioactivity; RL = radioactivity in light bottle after incubation; RD = radioactivity in dark bottle after incubation; [CO2] = concentration of total CO2 in sea water; t = incubation time
- Upwelling enhances primary production by elevated nutrient concentrations
- Coastal upwelling (Ekman)
- Oceanic upwelling: gyres and eddies
- Frontal upwelling: divergences and shelf break upwelling
- River plumes: stability of water column by freshwater, input of nutrients
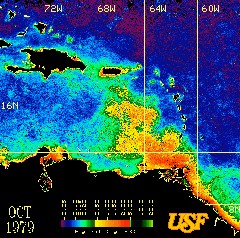
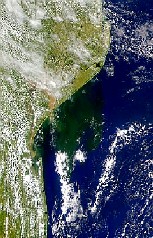
Left: High chloropyhll concentrations (red color) seen by satellite in the Orinoco River plume; Right: visible image from space showing the Limpopo River plume off Mozambique supporting a huge (green) phytoplankton bloom.
- Seasonal cycles of phytoplankton: driven by water temperature, stability, zooplankton abundance
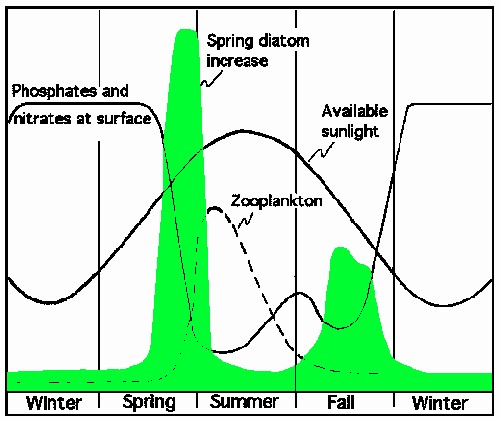
Typical seasonal pattern of phyto- and zooplankton abundance in the temperate North Atlantic. Notice the presence of a spring and fall phytopankton bloom, followed by an abundance maximum of zooplankton.
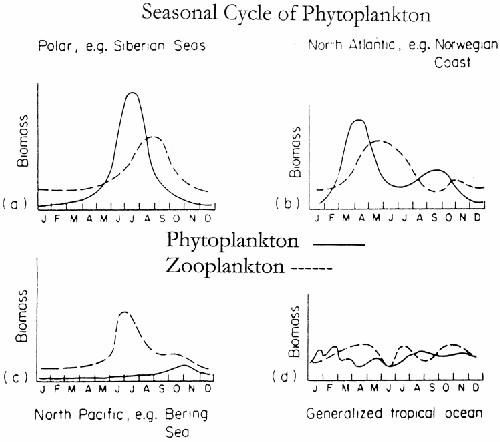
Seasonal cycle of phyto- and zooplankton at different latitudes. (a)
Polar seas only have one phytoplankton bloom because of the short growth
season (darkness in polar winter); (b) North Atlantic, see previous graph
for details; (c) North Pacific: due to an early abundance of zooplankton
a phytoplankton spring bloom is lacking; despite enhance primary production
in spring (Sverdrup model!) zooplankton abundance can be already high enough
to prevent phytoplankton biomass to build up; (d) the tropical ocean generally
lacks pronounced seasons, thus no pronounced seasonal cycle of plankton
abundance and production.
3. Seasonal Changes in Vertical Profiles of Production
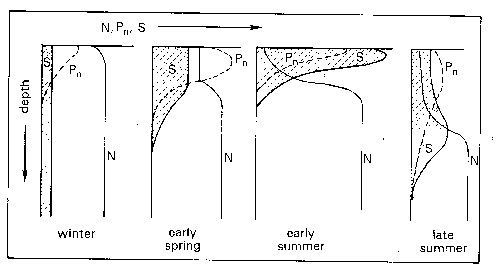
Seasonal
development of phytoplankton standing stock (S), net production (Pn), and
nutrient concentration (N) in a temperate ocean
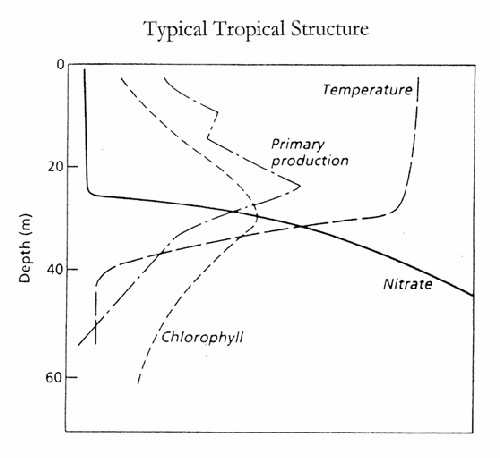
Typical
vertical profiles of phytoplankton biomass (chlorophyll), production, temperature,
and nitrate concentrations in the tropical, oligotrophic ocean
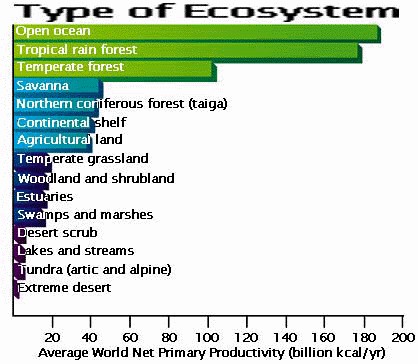
4. Global Primary Production
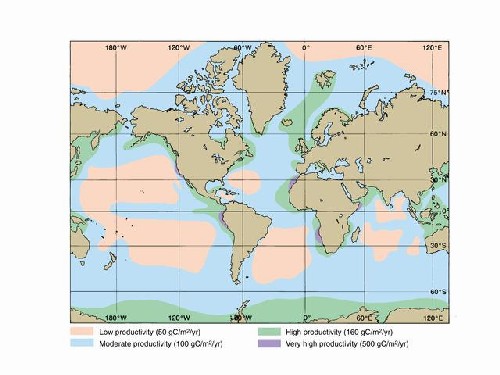
- Global primary production ranges 17-51x109 tons C yr-1 (avg. 40x109 tons C yr-1)
- >90% of marine production is by phytoplankton; benthic and macro- algae, coral reefs, marshes <10%
- Most productive: upwelling and continental shelf regions
!! Same magnitude as terrestrial plant production !!