- Definition of growth rates:
- Primary production: fixed carbon / time [µg C l-1 h-1]
- Assimilation Index: production normalized to biomass; helpful when comparing production in systems with different phytoplankton biomass [mg C (mg Chl.a)-1 d-1]
- Growth rate based on cell number: change of cell number over time; for unicellular organisms exponential function; symbol: µ, unit: d-1
- Doubling time: time for a population to double its cell number; unit: time [d]:
- Generation time: reciprocal of doubling time; number of generations produced per day; unit 1/time [d-1]
- Growth phases of algal cultures:
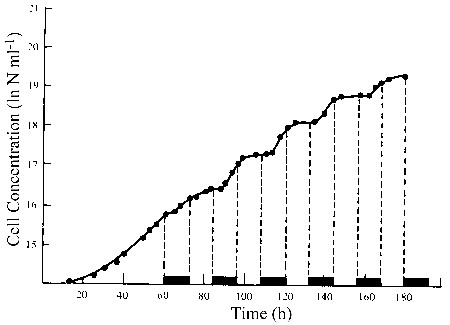
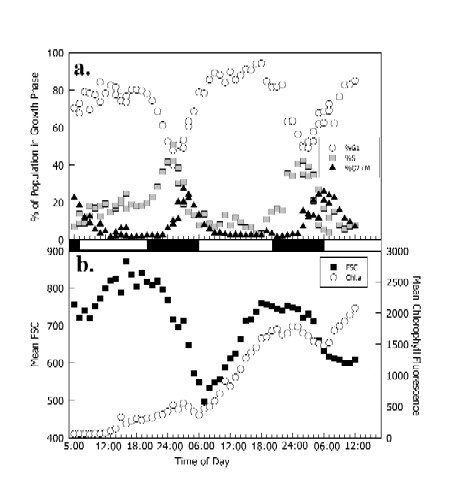
- DNA replication and cell division: occur during night in most species
- Cell growth (increase in cell volume) occurs during day in parallel to photosynthesis
- Makes sense: phytoplankton use day to acquire energy by photosynthesis, use this energy at night for DNA replication and cell division metabolism (synthesis of proteins and structural material), divide in the late night/early morning, so that daughter cells are ready for the next day of photosynthesis
- Exceptions: some algae (such as Synechococcus spp.) divide only at daylight
N0 + DN = N0 x eµt can be transformed to:
µ = [ln(Nt) - ln(N0)] x 1/t which equals
µ = ln(Nt/N0) x 1/t
d = ln(2) / µ = 0.69 / µ
G = µ / ln(2) = µ / 0.69
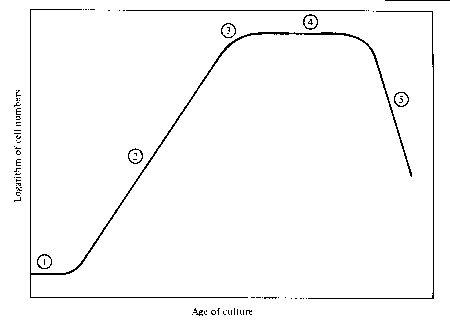
(1) = lag phase; cells use new nutrients to replenish their internal pools of nitrogen and phosphorous constitutents (proteins, chl.a)
(2) = exponential phase; cells grow according to the exponential growth function; if cell numbers are plotted on log scale versus time, the increase of cell number is linear
(4) = stationary phase; nutrients are exhausted, cell division and population growth stops
(5) = death phase; cells "starve"
- Nutrient uptake can be described similar to photosynthesis dependence on light
- Michaelis-Menten Model: hyperbolic function of nutrient uptake rate v with nutrient concentration S with vmax = maximum uptake rate; km = half saturation constant
- Monod Model: describes the dependence of growth rate µ on nutrient concentration
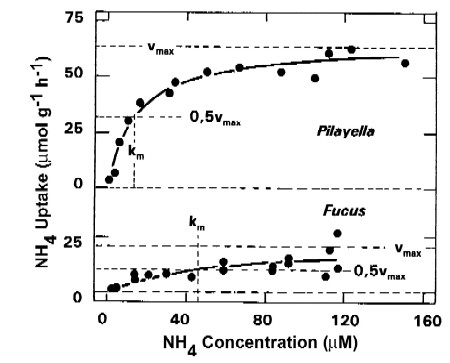
Ammonium uptake kinetics in two macroalgae
v = vmaxx S / (km + S)
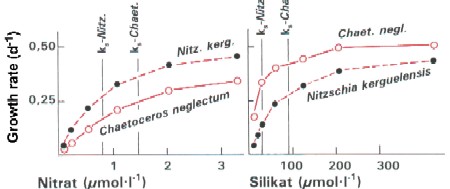
Growth rates of two diatom species in dependence of nitrate and silicate concentrations
µ = µmaxx S / (ks + S)
- Limitation: The total yield or biomass of any organism will be determined by the nutrient present in the lowest (minimum) concentration in relation to the requirements of that organism (Liebigs law of the minimum, 1840); for zooplankton, food is the limiting resource; light can also be a limiting resource for algae!
- Competition: under resource competition, those species with the lowest resource requirement or with the highest ability to utilize low resources will succeed in competition
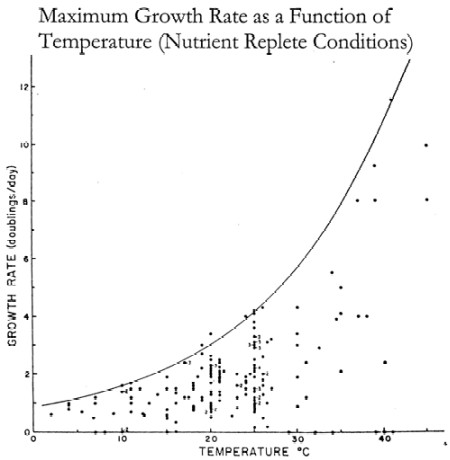
- External factors such as temperature may influence growth rates regardless of limitation and competition
- Redfield Ratio: elemental ratio of elements
- Size is an important factor in the competition for limiting nutrients: smaller cells are generally better adapted to low nutrient concentrations, because their higher surface/volume ratio provides more surface area per volume for nutrient uptake at the cell surface
- Regional distribution: Because small phytoplankton is better adapted to deal with limiting rescources (nutrients), pico- and nanoplankton are more dominant in oligotrophic, nutrient-poor systems and large microplankton is dominant in nutrient-rich upwelling regions
 Justus von Liebig
C : N : P = 106 : 16 : 1
(molar ratio!) under non-limiting conditions
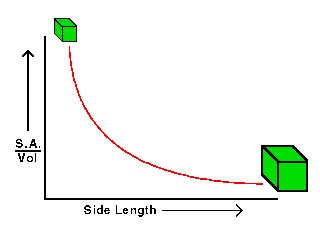
With increasing size or body length, the surface/volume ratio decreases
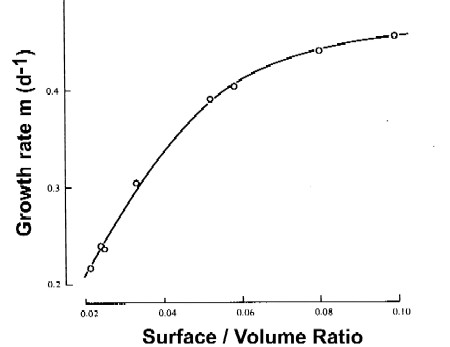
With increasing surface/volume ratio (which means decreasing size!), the growth rate increases in one species of diatoms
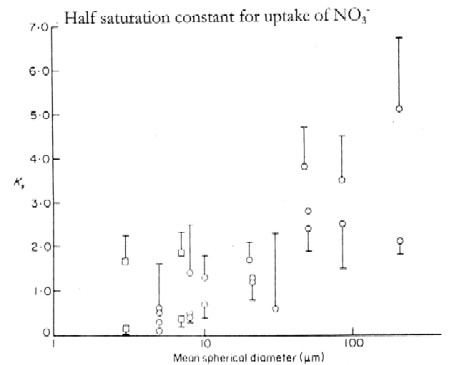
The half-saturation constant for nitrate uptake increases with mean spherical cell diameter, which means that bigger cells have a higher kS, thus a lower nitrate uptake ability.
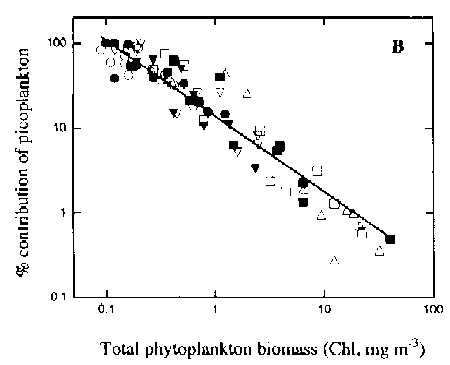
The contribution of picoplankton to total chl.a decreases towards systems with higher chl.a concentrations; high chl.a concentrations point towards higher nutrient concentrations as well to sustain the higher plankton biomass
- R*: resource concentration at which growth = death, minimum requirement
- Competition: if initial resource concentration R0 > R*, all species can grow; R will be lowered; if R reaches R*1 of species 1, this species can no longer grow if R is further lowered; in competition with another species 2 with lower R*2, species 2 will outgrow species 1 (R*2 < R*1)
Ability to compete: R* is an integrated measure of the competitiveness for a limiting resource; species differ in their R* for different nutrients / light
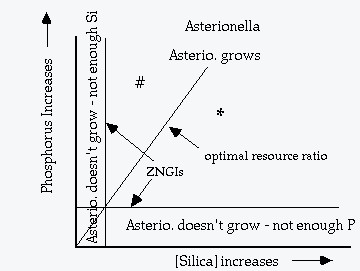
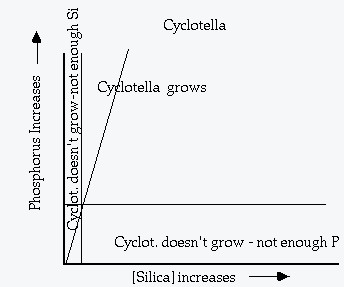
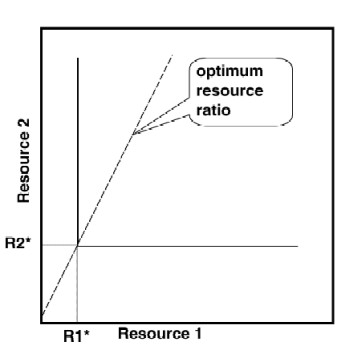
Two examples of plotting resource requirements on two parameter plots. Lines that mark the minimum recource requirement (starting from R* and parallel to the other axis) are called the ZNGI's (zero net growth isolines). The line from the origin of the plot through the intersection of the two ZNGI's represents the "optimum resource ratio".
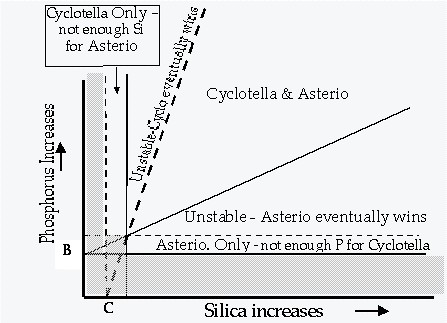
Diagram of the two above species of diatoms,
showing nutrient ratios under which only one of the two species can grow,
where one will outcompete the other, and where the two species will co-occur
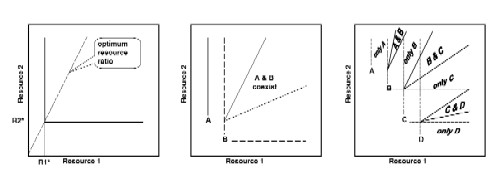
Theoretical construction of multi-species ZNGI's
plots, which indicate nutrient/resource ratios with allow for co-occurrence
of species or outcompeting by one species
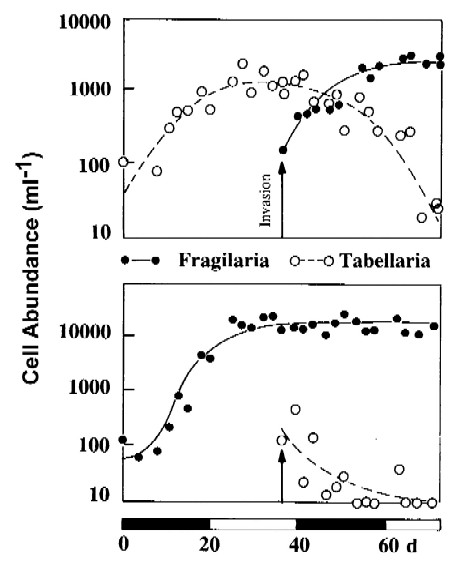
Because of better adaptation to the growth situation,
Fragillaria will coutcompete Tabellaria even when introduced
late in the culture growth (upper graph); if introduced into a going culture
of Fragillaria,
Tabellaria is not able to compete (lower
panel).
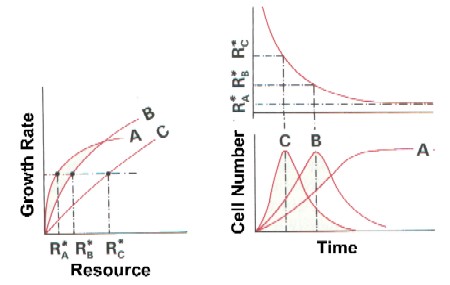
As resources are depleted by phytoplankton growth,
different species will dominate along time, according to their R*